VUE+ echarts图表动态获取后台数据详解 |
您所在的位置:网站首页 › echarts 动态数据折线 › VUE+ echarts图表动态获取后台数据详解 |
VUE+ echarts图表动态获取后台数据详解
|
总结一下自己最近项目中用echarts动态获取接口数据并画图的方法。 1、对原型的理解与需求分析话不多说,先看下原型:
需求分析明确后,开始画图吧! 2、echarts图表绘制代码如下: AI预警系统 各类型告警占比统计 本周 本月 本年 各监控点告警数量占比统计 本周 本月 本年 各类型告警发生量统计 本周 本月 本年绘制完图表后,我们来处理下数据: 3、数据和方法的处理在数据处理之前,接口的引入和接口定义的方法这里就不展示了,先来看下data中数据初始化吧: data() { return { pickerOptions: { disabledDate(time) { return time.getTime() > Date.now(); } }, form: { typeDate: '', addressDate: '', trendDate: '', // startTime 和 endTime是调用接口时往后台传递的参数 startTime: '', endTime: '' }, color: '#000', color1: ['#3AA1FF', '#64BAFF', '#48a5ff', '#3b88e1', '#336fc2', '#325ea1'], color2: ['#3fa1ff', '#78e7fc', '#23d8bc', '#7af0c8', '#77ca45', '#addf83', '#ffd05a', '#e88657', '#e55757', '#f7a798', '#a566fb'], // 以下是用来存储接口返回的数据 warnPlaceDate: [], warnTypeDate: [], legendData: [], xAxisData: [], itemData: [] }; },组件加载完后,需要调用接口,每个图默认显示的是本周的数据,如下: 这里调用接口的两个参数分别是事件类别和时间类别,后边会说到 mounted() { this.getWarningType('type', 'week'); this.getwarningAddress('address', 'week'); this.getwarningTrend('trend', 'week'); },接下来看看methods中都有哪些方法吧,因为要分开说,所以直接上方法吧: 首先是画图的方法: drawLeftChart() { const myChart = this.$echarts.init(document.getElementById('block-left-chart')); myChart.setOption({ tooltip: { trigger: 'item', formatter: '{a} {b} ({d}%)', }, label: { color: this.color }, labelLine: { lineStyle: { color: this.color }, smooth: 0.2, length: 10, length2: 20 }, series: [{ name: '预警类型', type: 'pie', roseType: 'radius', radius: '75%', data: this.warnTypeDate }] }); }, drawRightChart() { const myChart = this.$echarts.init(document.getElementById('block-right-chart')); myChart.setOption({ tooltip: { trigger: 'item' }, label: { color: this.color, formatter: '{b} {d}%' }, labelLine: { lineStyle: { color: this.color }, smooth: 0.2, length: 10, length2: 20 }, legend: { bottom: 0, data: this.warnPlaceDate }, series: [{ name: '预警类型', type: 'pie', radius: ['35%', '55%'], center: ['50%', '40%'], data: this.warnPlaceDate }] }); }, drawBottomChart() { const myChart = this.$echarts.init(document.getElementById('block-bottom-chart')); myChart.clear(); const options = { tooltip: { trigger: 'axis', axisPointer: { type: 'shadow' } }, legend: { icon: 'rect', itemWidth: 10, itemHeight: 10, itemGap: 20, data: this.legendData, left: 30 }, grid: { left: '3%', right: '3%', bottom: '3%', containLabel: true }, xAxis: [{ type: 'category', axisLine: { show: false }, axisTick: { show: false }, axisLabel: { color: '#9AA1A9' }, boundaryGap: false, data: this.xAxisData }], yAxis: [{ type: 'value', axisLine: { show: false }, axisTick: { show: false }, axisLabel: { color: '#9AA1A9' } }], series: this.itemData }; myChart.setOption(options); myChart.resize(); },接下来比较艰巨的一个任务就是对时间格式的处理,el-date-picker 的默认时间格式是 yyyy-MM-dd,而我们页面上需要显示的格式是yyyy/MM/dd,需要传递给后端的时间格式为yyyyMMdd,而后端返回来的时间格式为:yyyyMMdd,这里格式简单的说下,大家可以根据自己的需求来定 时间格式以及格式化的处理 // 封装时间查询的方法 // 参数 formType 和 dateType分别代表事件类别和时间类别 selectDate(formType, dateType) { const formDate = { ...this.form }; let startDate; let startDateView; // 展示在页面的数据 let endDate = moment(new Date()).format('YYYYMMDD'); const endDateView = moment(new Date()).format('YYYY/MM/DD'); // 展示在页面的数据 // 按时间查询 if (dateType === 'week') { const d = new Date(); const day = d.getDay(); const date = d.getDate(); if (day === 0) { d.setDate(date - 6); } else { d.setDate(date - day + 1); } startDate = moment(d).format('YYYYMMDD'); startDateView = moment(d).format('YYYY/MM/DD'); } else if (dateType === 'month') { const startMoment = moment().startOf('month'); startDate = startMoment.format('YYYYMMDD'); startDateView = startMoment.format('YYYY/MM/DD'); } else if (dateType === 'year') { const startMoment = moment().startOf('year'); startDate = startMoment.format('YYYYMMDD'); startDateView = startMoment.format('YYYY/MM/DD'); } // 按类别(类型、地点、趋势)来查,设值 if (formType === 'type') { if (!dateType) { startDate = moment(this.form.typeDate[0]).format('YYYYMMDD'); endDate = moment((this.form.typeDate[1])).format('YYYYMMDD'); } else { this.form.typeDate = [startDateView, endDateView]; } } else if (formType === 'address') { if (!dateType) { startDate = moment(this.form.addressDate[0]).format('YYYYMMDD'); endDate = moment(this.form.addressDate[1]).format('YYYYMMDD'); } else { this.form.addressDate = [startDateView, endDateView]; } } else if (formType === 'trend') { if (!dateType) { startDate = moment(this.form.trendDate[0]).format('YYYYMMDD'); endDate = moment(this.form.trendDate[1]).format('YYYYMMDD'); } else { this.form.trendDate = [startDateView, endDateView]; } } formDate.startTime = startDate; formDate.endTime = endDate; return formDate; },这个方法看着很庞大,不要害怕哈,上半部分主要是获取参数dateType,包含参数 startDate 和 endDate, 分为四种情况,type(week month year) 和 !type, type(week month year) 对应btn的数据, !type 对应 el-date-picker 的数据 下半部分主要是通过参数 formType 来获取 各自的 dateType 的情况 这两个参数的含义上边有提到,这里不说了 接下来处理时间的一些细节问题,也就是在折线图中的 x轴时间轴,时间的返回格式。 上边有说到过,如果是按照 !type和本周、本月查询,返回每日的数据,如果按照本年来查,返回的是每月的数据,这里数据的统计是后端处理好的,我们只需要拿到数据并渲染出来 时间轴时间的格式处理 有个细节需要注意下,如果某天或者某月没有数据时,后端是不会返回数据的,但是在前端页面上需要展示数据为0,所以如果我们像往常一样正常遍历的话,数据会出现错乱的问题 所以这块需要前端处理,后边会说到处理方法,先看下时间的获取吧 // 获取日期范围内所有天数 getYearAndMonthAndDay(start, end) { const dateAll = []; let i = 0; const startTime = this.getDate(start); const endTime = this.getDate(end); while ((endTime.getTime() - startTime.getTime()) >= 0) { const year = startTime.getFullYear(); const month = (startTime.getMonth() + 1).toString().length === 1 ? "0" + (startTime.getMonth()).toString() : (startTime.getMonth()).toString(); var day = startTime.getDate().toString().length === 1 ? "0"+startTime.getDate() : startTime.getDate(); dateAll[i] = year + "-" + month + "-" + day; startTime.setDate(startTime.getDate() + 1); i += 1; } return dateAll; }, getDate(datestr) { return new Date(datestr.substring(0, 4), datestr.substring(5, 7), datestr.substring(8, 10)); }, // 获取日期范围内所有月 getYearAndMonth(start, end) { let result = []; const starts = start.split('/'); const ends = end.split('/'); let staYear = parseInt(starts[0]); let staMon = parseInt(starts[1]); const endYear = parseInt(ends[0]); const endMon = parseInt(ends[1]); result.push(staYear + "-" + starts[1]); // result.push(endYear+"-"+ends[1]); while (staYear let staMonStr = ''; while (staMon staMonStr = "0"+staMon; } result.push(staYear + "-" + staMonStr); } staYear++; } else { staMon++; var staMonStr = ""; if (staMon > 12) { staMon = 1; staYear++; } if (staMon const formDate = this.selectDate(formType, type); const data = { ...formDate }; const resp = await warningType(data).then(); if (resp.code === '1000') { if (resp.result) { this.warnTypeDate = []; const res = resp.result; for (let i = 0; i this.warnTypeDate[i] = { name: resData.eventName + `\n` + resData.num, value: resData.num, itemStyle: { color: this.color1[i] } } JSON.stringify(this.warnTypeDate); this.warnTypeDate.sort(this.compareValue("value")); } } this.drawLeftChart(); } } }, async getwarningAddress(formType, type) { const formDate = this.selectDate(formType, type); const data = { ...formDate }; const resp = await warningAddress(data).then(); if (resp.code === '1000') { if (resp.result) { this.warnPlaceDate = []; const res = resp.result; for (let i = 0; i this.warnPlaceDate[i] = { name: resData.monitorPoint, value: resData.num, itemStyle: { color: this.color2[i] } }; } } this.drawRightChart(); } } },大家有注意到第一个饼图的方法里有个没定义的方法吗,compareValue的方法是对数据进行排序,因为第一个饼图是马丁格尔图,排下序更美观一点,方法如下: compareValue(protoTypeName) { return function(object1,object2){ var val1 = object1[protoTypeName]; var val2 = object2[protoTypeName]; if(val1 return -1; }else{ return 0; } } },接下来最重要的折线图的方法来了,因为这个折线图数据结构比较特殊,所以先上接口数据吧(以本年为例) 饼图的数据都是从result中获取的,就不说了,到这里,所有的图表就都完成了,晚安吧 |
 这里的需求是:选取el-date-picker中的自定义时间、点击本周、本月、本年时,将数据显示在饼图中
 这里的需求是:选取el-date-picker中的自定义时间、点击本周、本月、本年时,将数据显示在饼图中
 这里的需求是:选取el-date-picker中的自定义时间、点击本周、本月时,折线图的X轴(时间轴)返回的日期格式是每天的统计量
  这里的需求是:点击本年时,折线图的X轴(时间轴)返回的日期格式是每月的统计量
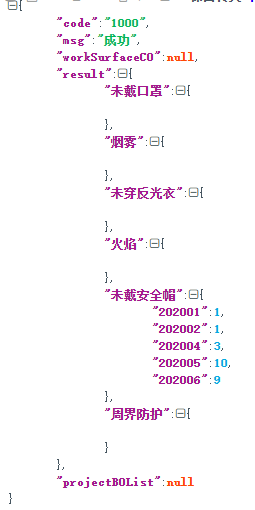 代码如下,可以对着数据看代码,比较好理解数据的处理
【本文地址】
今日新闻 |
推荐新闻 |